Virtual Gel Image
Virtual gel images can be created for DNA stack simulations that use only X signals. These X signals are interpreted as linear write signals when the gel image is created.
Warning
A simulation experiment should not involve Y signals if you wish to display the output as a virtual gel image. Only X signals are allowed, and they are interpreted as write signals when a gel image is made.
To take an example, the function example_vgel() in constants.py defines a demo gel that can be displayed as a virtual gel image.
First, run a simulation of each lane of the gel, as described previously:
python3 washing.py example_vgel 2
python3 washing.py example_vgel 3
python3 washing.py example_vgel 4
python3 washing.py example_vgel 5
The simulation results of each lane will be stored in the results directory as a pickle file.
When all simulations are complete, two alternative virtual gel images can be made:
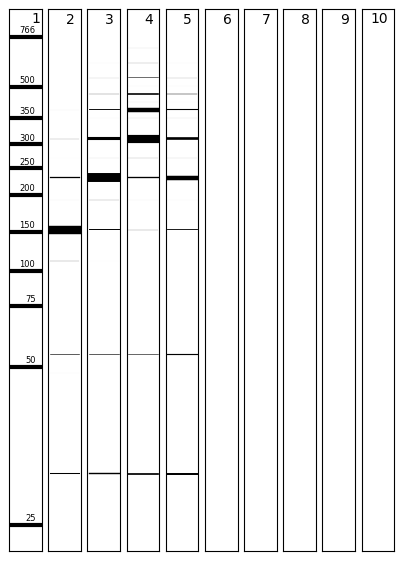
A virtual gel showing the state of the supernatant solution following a final wash and addition of releaser. The releaser moves stacks attached to beads into supernatant solution. This type of virtual gel is used to get an idea of system state, and is used Figure 2 of the paper:
python3 vgel.py example_vgel releaser
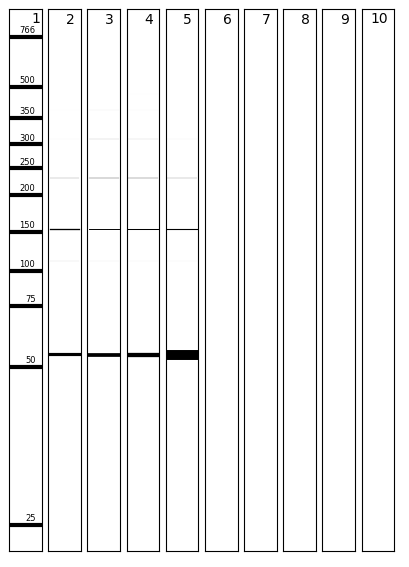
A virtual gel showing the state of the supernatant solution only, after the last strand was added and the final wait time waited. Stacks attached to beads remain attached to beads and do not make it into supernatant solution. This shows the “readout” of the DNA stack device as used in Figure 4c and 4d (lanes 6,7,8) of the paper:
python3 vgel.py example_vgel supernatant
The above two commands each place a PNG image of the virtual gel in the results directory. The external program ImageMagick is used to rotate the images. Additionally, a text file is made, detailing the bands in each lane and their relative mass concentrations.
The NEB low molecular weight ladder is displayed in lane 1 of the virtual gel.
Band thickness is controlled by the MASS_CONC_TO_LINEWIDTH_MULTIPLIER parameter in vgel.py.
See paper Supplementary Information for electrophoretic mobility analysis of linear DNA stack complexes.